Ver6.1.1 “Graphical Master View”, an easy to use master data editor
The Graphical Master View is perfect for:
- quick construction and maintenance of processes for make-to-order production, and checking with flow charts
- to check the master data imported from ERP with graphical representation
- to view processes of both finished and bulk produced products in the same chart
- to intuitively, and easily operate the master with a graphical representation
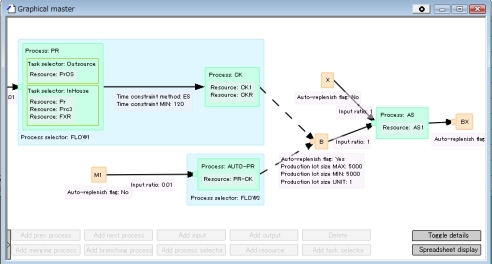
The Graphical Master View is a new type of chart which displays the information contained in the integrated master table in a graphical format, and allows editing of the master data directly in the view.
The Graphical Master View shows a graphical representation of:
- process flow
- relationship of intermediate, input, and output items
- resources used by each process
- production lot size settings
The Graphical Master View presents processes of both intermediate and final items in the same graphical window, effectively allowing editing of assembly process
The Graphical Master View allows effective editing and maintenance with a variety of graphical interfaces, using buttons, pop-ups and drug-and-drop operations with the mouse.

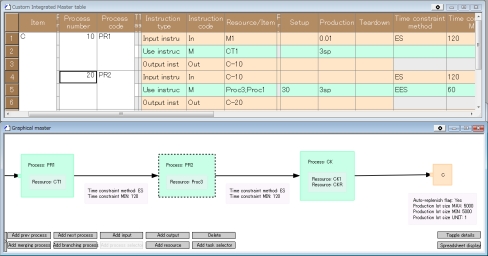
The Graphical Master View and the Integrated Master’s spread sheet are linked with each other, and any data change will be reflected immediately.
This feature allows even more effective data maintrinance, taking advantage of the strengths of both the graphical view and the spreadsheet.

Asprova HELP for the Graphical Master View is found at
(The page appears can be found by searching with the above number)
*** Asprova Pocket Manual series ***
